What to do when your build hangs on the Hosted Pool...
When your build freezes and you can't remote into the agent... You're basically blinded...
Both GitHub actions and Azure Pipelines offer the ability tor un your CI pipeline in the cloud. These agents are provisioned in Azure and fully maintained by Microsoft. These hosted runners are cost effective, require no maintenance and are basically free to use in many cases.
But what to do when your build just freezes and stops responding?
If this were your own runner, or if it's hosted by your company, you could probably remote into the machine to see what's going on. Unfortunately, that's no option with the hosted runners.
After cancelling the build you could inspect the logs for any hints, but they may not reveal anything useful either.
Now what?!
What I really wanted, was to have a quick peek at the desktop of the agent. A screenshot would do... So that is what I set out to accomplish. A quick google gave me 9 different command-line tools to grab a screenshot of the desktop and one stood out for its ease of use screenshot-cmd. It's a simple portable executable that can be downloaded directly. So I cobbled up a little PowerShell to download and run it and add the screenshot to the logs:
Invoke-WebRequest -Uri "https://storage.googleapis.com/google-code-archive-downloads/v2/code.google.com/screenshot-cmd/screenshot-cmd.exe" -OutFile "$(Agent.ToolsDirectory)\screenshot-cmd.exe"

& "$(Agent.ToolsDirectory)\screenshot-cmd.exe"

Write-Host "##vso[task.uploadfile]$(Agent.ToolsDirectory)\screenshot.png"
and got a screenshot in the logs:
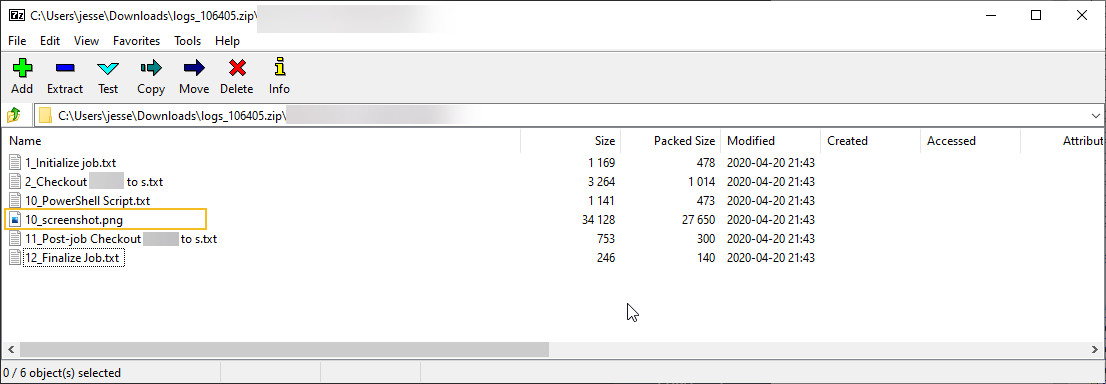
Telling me... nothing...
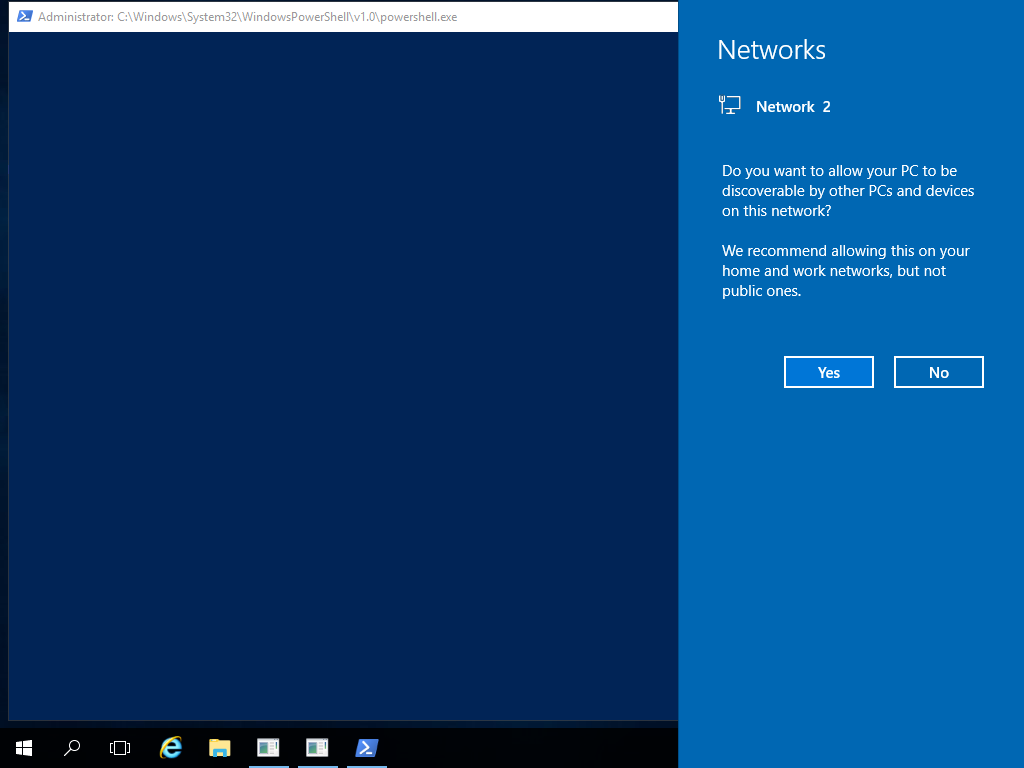
And some more StackOverflow hunting lead me to a snippet to minimize that console.
Add-Type -Name ConsoleUtils -Namespace WPIA -MemberDefinition @'
      [DllImport("Kernel32.dll")]
      public static extern IntPtr GetConsoleWindow();
      [DllImport("user32.dll")]
      public static extern bool ShowWindow(IntPtr hWnd, Int32 nCmdShow);
   '@

$ConsoleMode = @{
    HIDDEN = 0;
    NORMAL = 1;
    MINIMIZED = 2;
    MAXIMIZED = 3;
    SHOW = 5
    RESTORE = 9
}

$hWnd = [WPIA.ConsoleUtils]::GetConsoleWindow()
[WPIA.ConsoleUtils]::ShowWindow($hWnd, $ConsoleMode.MINIMIZED)
Which finally revealed:
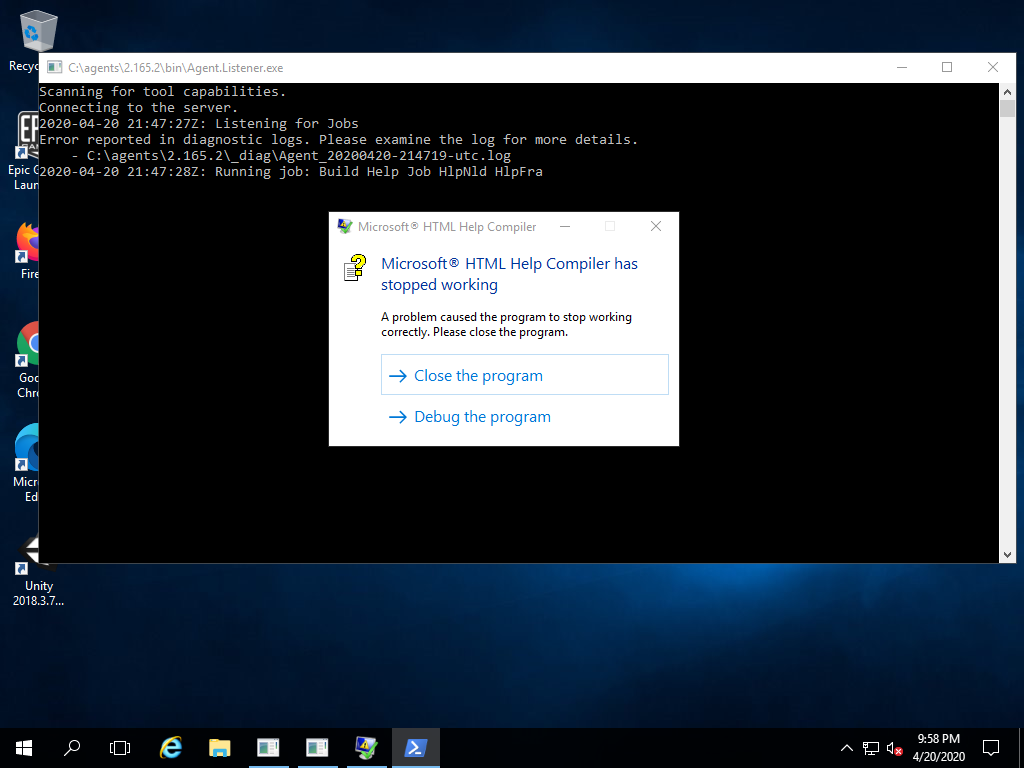
Disabling the Just-in-time debugger is a simple matter of resetting a couple of registry keys. And now the build no longer freezes and is telling me what's wrong.
& reg add "HKLM\SOFTWARE\Microsoft\Windows NT\CurrentVersion\AeDebug" /v Debugger /d - /t REG_SZ /f
& reg add "HKLM\SOFTWARE\Microsoft\.NETFramework" /v DbgManagedDebugger /d - /t REG_SZ /f
& reg add "HKCU\Software\Microsoft\Windows\Windows Error Reporting" /v DontShowUI /d 1 /t REG_DWORD /f
Bliss!
Putting it all together
The final script looks like this (in YAML):
steps:
- powershell: |
   Add-Type -Name ConsoleUtils -Namespace WPIA -MemberDefinition @'
      [DllImport("Kernel32.dll")]
      public static extern IntPtr GetConsoleWindow();
      [DllImport("user32.dll")]
      public static extern bool ShowWindow(IntPtr hWnd, Int32 nCmdShow);
   '@

   $ConsoleMode = @{
    HIDDEN = 0;
    NORMAL = 1;
    MINIMIZED = 2;
    MAXIMIZED = 3;
    SHOW = 5
    RESTORE = 9
    }

   $hWnd = [WPIA.ConsoleUtils]::GetConsoleWindow()

   $a = [WPIA.ConsoleUtils]::ShowWindow($hWnd, $ConsoleMode.MINIMIZED)

   Invoke-WebRequest -Uri "https://storage.googleapis.com/google-code-archive-downloads/v2/code.google.com/screenshot-cmd/screenshot-cmd.exe" -OutFile "$(Agent.ToolsDirectory)\screenshot-cmd.exe"
   & "$(Agent.ToolsDirectory)\screenshot-cmd.exe"
   Write-Host "##vso[task.uploadfile]$(Agent.ToolsDirectory)\screenshot.png"
  workingDirectory: '$(Agent.ToolsDirectory)'
  displayName: 'PowerShell Script'
  condition: always()
The condition: always() ensures that the screenshot is taken after a request to cancel the build has been sent.
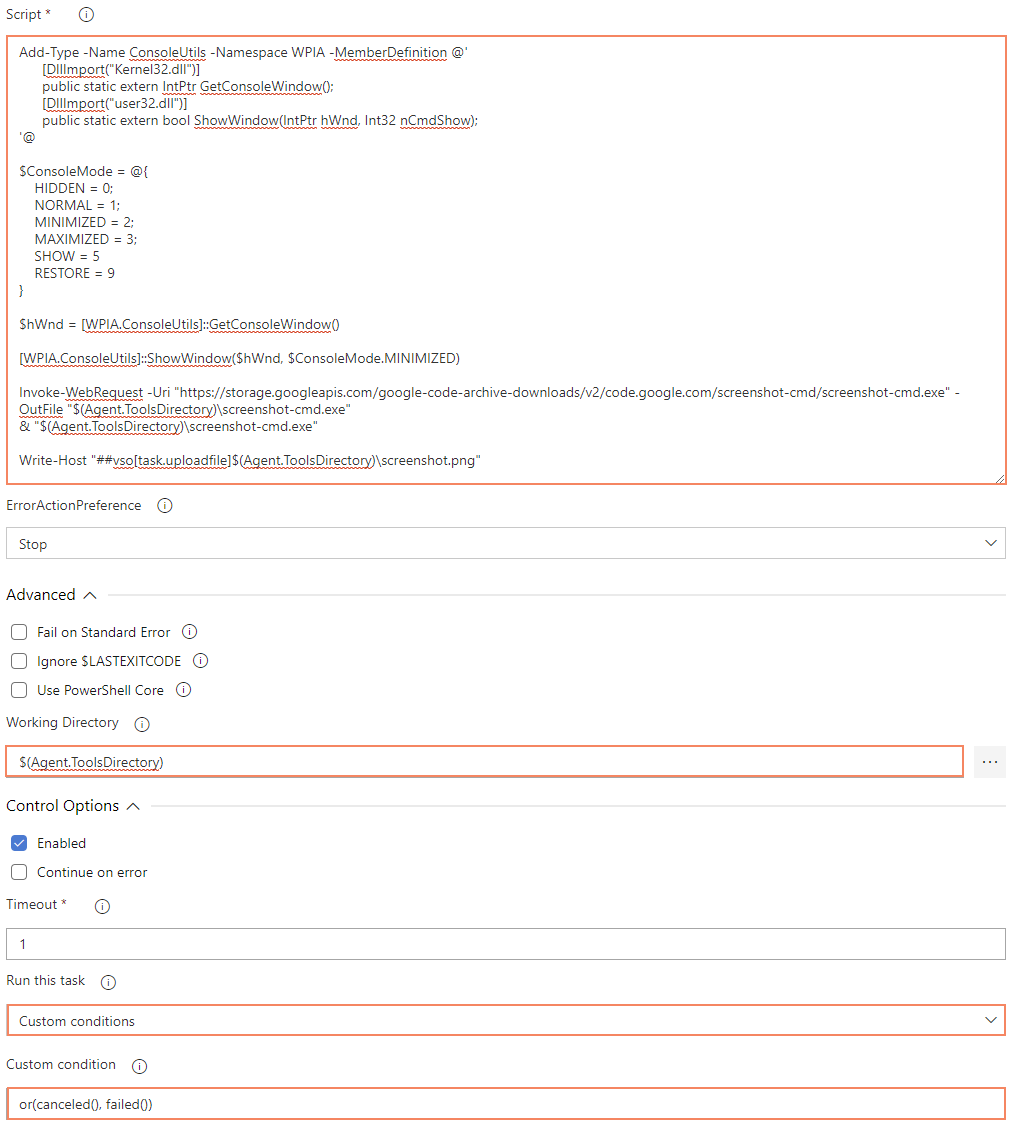
And this is the UI based equivalent:
Want a fancier solution?
Then grab the extension from the Azure DevOps Marketplace,

